WPF Data Binding: Harmonic Series Visualization
Recently I was speaking at TechEd Europe. One of my talks was on WPF data binding, and I wanted to show some of the things that make WPF data binding different from Windows Forms. So I wrote a little demo that shows a couple of interesting data binding techniques: user interface generation, and graphical data visualization.
The demo looks like this:
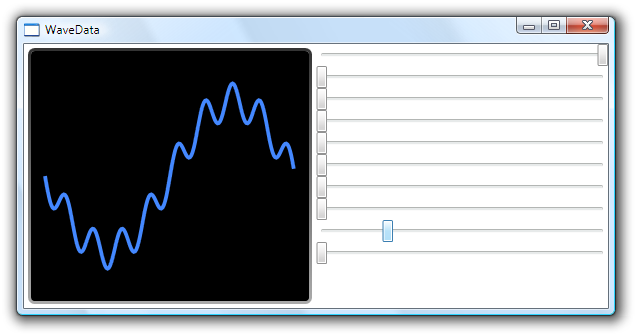
The application lets you build a waveform from a harmonic series. The sliders on the right control the amplitudes of the harmonics, and the screen area on the left displays the result. The wave is updated continuously: you can see the wave shape change as you drag the sliders around. This screen shot shows the fundamental at maximum amplitude, with the 8th harmonic added in at a lower amplitude. This results in the overall shape roughly following a single cycle of a sine wave, but with higher frequency wiggles superposed. Given enough harmonics you can recreate any repeating wave form if you get the right set of amplitudes.
The application uses data binding in three different ways. The most striking is the waveform output. Here's the XAML I used:
<Polyline Stroke="#48F" StrokeThickness="1.5"
    Points="{Binding Output,
            Converter={StaticResource pointConverter}}"
    Canvas.Top="50" />
Polyline is a graphical element that renders a line that passes through many
points. This is bound to the Output propery of the UI's DataContext,
which holds an instance of a class I wrote called HarmonicSeries. Here's the
Output property:
public double[] Output
{
    get { return outputValues; }
}
Pretty straightforward really. The HarmonicSeries class implements the
INotifyPropertyChanged interface, raising the PropertyChanged event every time
it recalculates the output wave. Besides that, it does nothing to help the UI. HarmonicSeries
contains no WPF-specific features.
But how does binding this property to Polyline.Points work? That property expects a
PointCollection, not a double array. The answer is
that I'm using a value converter. My project contains a class that converts from a
double array to a PointCollection, and I
told the Binding to use that. So it simply calls that code every time it reads a new
set of points from the Output property.
You might want to check out a couple of other blogs that show various takes on binding to a
Polyline. Beatriz Costa is a PM on the WPF data binding team, and she wrote a series of blog entries on this:
part 1,
part 2,
and part 3.
Zhou Yong takes a somewhat different
approach, writing a class that
wraps the underlying data
with a dependency property as well as converting it. (Note that while one of the
benefits Zhou Yong shows with his approach is that he doesn't need to do the explicit
call to Measure and Arrange. However, my approach didn't seem to need that either.
I think that issue was specific to the second of Beatriz's examples.)
The second place I'm using data binding is a little more subtle. I'll show you the data source
property before I show you the binding. This is another property on the HarmonicSeries class:
public Amplitude[] Amplitudes
{
    get { return amplitudeValues; }
}
This stores the amplitude for each harmonic. Amplitude is another class in the project,
and a desperately simple one: it's just wraps an INotifyPropertyChanged implementation
around a double. Initially I thought I'd be able to use an ObservableCollection of doubles,
but that turns out to be backwards: what I need is a collection of observable doubles, which is not
the same thing. So, bearing that in mind, now let's look at the next two data binding expressions:
<ItemsControl x:Name="amplitudeSliders" Grid.Column="1"
              ItemsSource="{Binding Amplitudes}">
  <ItemsControl.ItemTemplate>
    <DataTemplate>
      <Slider Minimum="0" Maximum="1" Value="{Binding Value}"
              SmallChange="0.01" LargeChange="0.1" />
    </DataTemplate>
  </ItemsControl.ItemTemplate>
</ItemsControl>
This is the markup for the right hand side of the UI. That's all of it - this generates
all ten Slider controls. I'm using the ItemsControl to perform
this generation. ItemsControl is the base class of controls like ListBox,
ComboBox, TreeView etc. It provides the basic item generation and data binding
support, and the derived list controls then add the standard behaviours for these common controls. But
you can just use the base class itself. I'm using it to bind to the amplitudes, generating an instance
of the DataTemplate for each amplitude in the source.
The third place I'm using data binding is the generated slider itself. It's straightforward: it
just binds to the Value in the Amplitude class. The one moderately interesting
thing about this is that each instance of the DataTemplate will have its
DataContext set to the source item for which it's being generated, i.e. the relevant
Amplitude object. This is why I'm able to use a Binding expression inside
of a the UI that was generated by data binding. It's more common to see bindings in data templates
used simply to display data, or perhaps to hook up a TextBox. I wanted to show a
slightly less common example. And I thought this visual illustration of the point was more fun
than illustrating the same concepts with dry text controls.
If you were at TechEd Europe this year, you should already have this demo. For everyone else, you can download the source and binary from here: WaveData.zip.